finAgent — Your AI Financial Assistant
finAgent answers any financial question — from live prices to complex portfolio analyses. The more context you provide, the more precise and personalised the answers become.
How to Get the Most Out of finAgent
- Just start with a question — no special format required
- Use the suggested follow-up questions for deeper insights
- Enable your portfolio data for personalised answers
- Check the visualisations on the right — charts, comparisons, performance graphics
What You Can Ask
Quick Facts
- Current price of a stock (e.g. Tesla, Apple, SAP)
- Index levels (DAX, S&P 500, NASDAQ)
- Next dividend payment date
Company Analysis
- Current valuation and key metrics
- Analyst opinions and price targets
- Latest quarterly results and what they mean
Comparisons & In-Depth Research
- P/E ratio comparison within a sector
- Dividend yield rankings of top payers
- Sector performance comparison
- Competitor analysis (e.g. Tesla vs. BYD)
Research & Documents
- Latest SEC filings and quarterly reports
- Insider transactions
- Macroeconomic context and implications
Data Sources
finAgent draws on a broad range of real-time and fundamental data:
- Real-time market data and historical price histories
- Analyst ratings and price targets
- SEC filings and regulatory documents
- Company fundamentals and valuation metrics
- Dividend history and forecasts
- Macroeconomic indicators
Portfolio Personalisation
When you enable your portfolio data, generic answers become genuinely personal analyses. finAgent then takes into account:
- Your current positions and their weighting
- Your individual performance
- The structure and diversification of your portfolio
- How market movements affect your specific holdings
Try asking: "How does the current rise in interest rates affect my portfolio?" — finAgent won't give a generic answer, but one tailored to your exact positions.
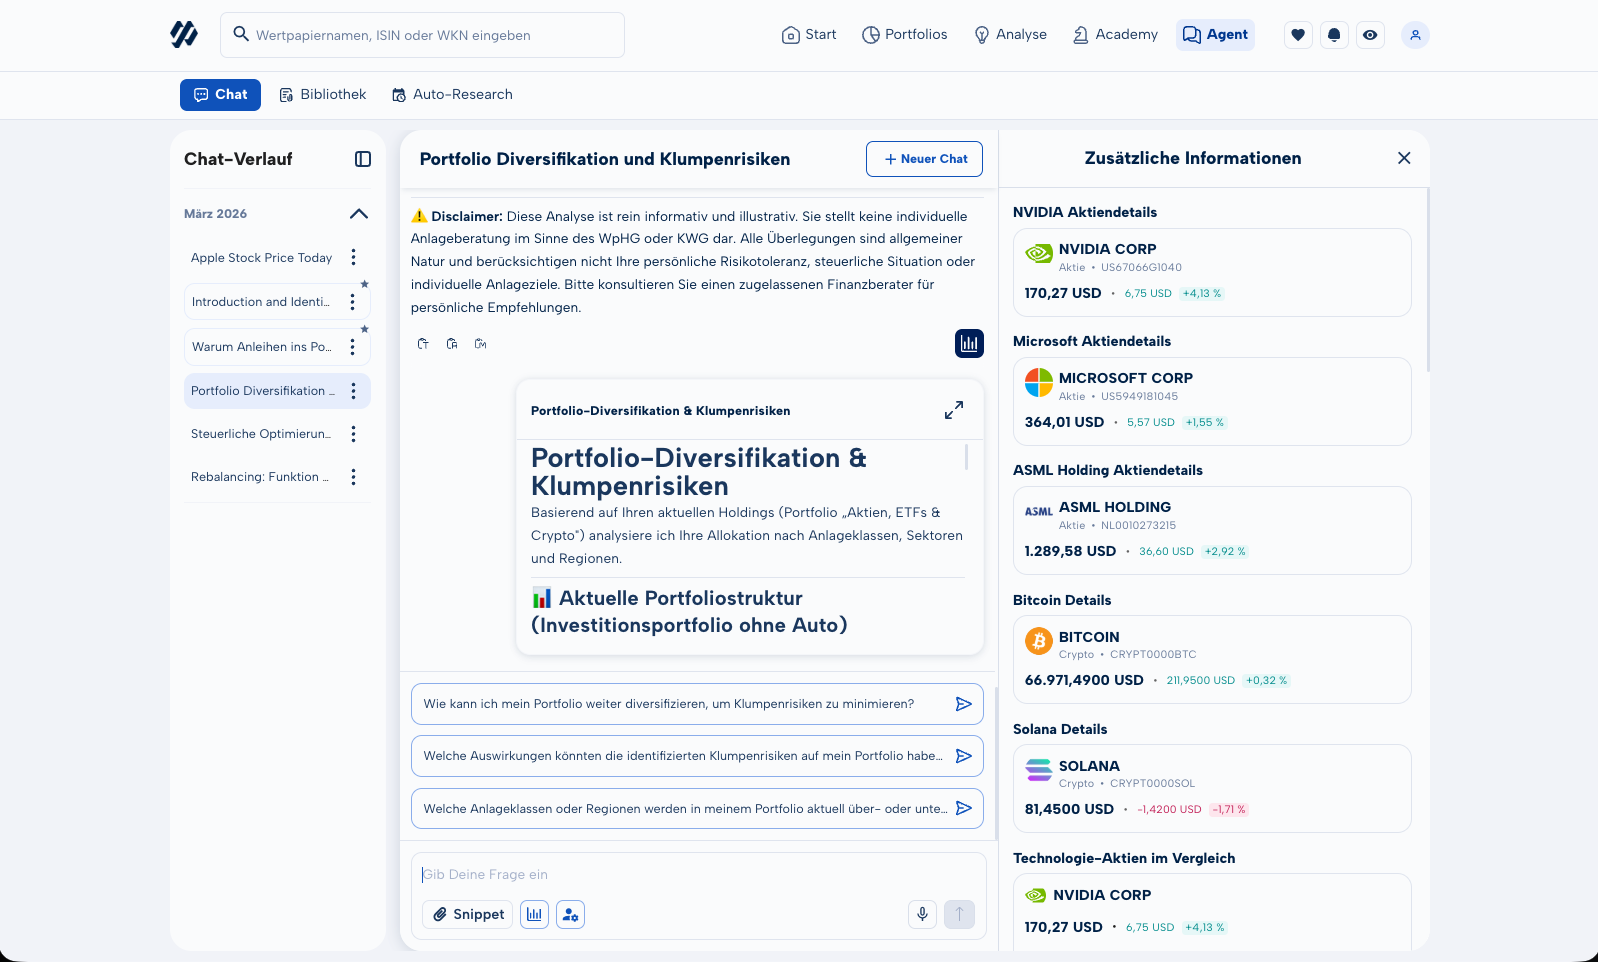
Chat History & Visualisations
All conversations are saved and can be searched and revisited at any time. As you ask questions, finAgent automatically generates charts, comparison graphics, and performance summaries on the right-hand side of the screen.